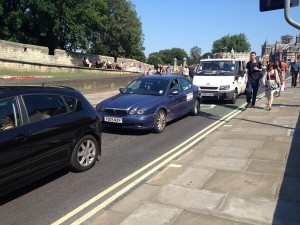
No significant change to Park and Ride bus service journey times as total number fined climbs to 45,000.
The Council have now published an updated report on their web site assessing the impact of the Lendal Bridge closure.
Any hopes that the information would be objective and impartial are quickly dispelled as the report resorts to sloganising “York remains very much open for business” whatever that is supposed to mean.
The figures for Park and Ride show small increases in the number of passengers (following a trend evident for the last 6 years over which passenger growth on the services has been sustained each year).
Some services show small reductions in journey times since the Lendal Bridge restrictions were introduced. Others – like the link to the Designer Centre – show increases in journey times.
This rather confirms what is so obvious to many – that traffic congestion, on alternative routes to Lendal, is continuing to increase.
No information is provided on normal “stage carriage” bus services.
There was a 10% increase in traffic volumes on Clifton bridge when comparing November 2013 with the same month last year. Increased traffic volumes on Foss Islands Road are also evident.
The report makes no attempt to assess increases in journey times or costs for drivers. There is no information about pollution levels
The Council has also updated the tables showing the number of Penalty Charge Notices issued to drivers on Lendal Bridge and in Coppergate.
The numbers fined on Coppergate doubled to 595 during the St Nicholas Fayre week.
The number issued on Lendal Bridge is still regularly in excess of 2500 a week.
70% of the tickets issued are to visitors to the City
| Lendal: | |
| 02-08 Sept (4 days enforcement, commenced Wednesday | 1675 |
| 09-15 Sept 2015 (6 days enforcement, because of the Skyride event) | 2015 |
| 16-23 Sept (5 days enforcement, cameras updating) | 1766 |
| 23 – 29 September 2,762 PCNs issued (6 days enforcement) | 2762 |
| 30 Sep – 6 October 1,885 PCNs issued (5 days enforcement) | 1885 |
| 7 – 13 October 2,487 PCNs issued (5 days enforcement) | 2487 |
| 14 – 20 October 3,640 PCNs issued | 3640 |
| 21 – 27 October 3,879 PCNs issued | 3879 |
| 28 Oct – 3 November 4,098PCNs issued | 4098 |
| 4 – 10 November 1,921 PCNs issued | 1921 |
| 11 – 17 November 3,172 PCNs issued | 3172 |
| 18 – 24 November 2,801 PCNs issued | 2801 |
| 25 Nov – 2 December 2,553 PCNs issued | 2553 |
| Coppergate: | |
| 15-18 August (4 days enforcement, commenced Wednesday) | 1085 |
| 19-25 August | 1741 |
| 26-01 Sept | 880 |
| 02-08 Septd | 850 |
| 09-15 Sept (6 days enforcement, because of the Skyride event) | 841 |
| 16-22 Sept (5 days enforcement, cameras updating and gas works commenced) | 324 |
| 23 – 29 September 405 PCNs issued (6 days enforcement) | 405 |
| 30 Sep – 6 October 345 PCNs issued (5 days enforcement) | 345 |
| 7 – 13 October 593 PCNs issued (5 days enforcement) | 593 |
| 14 – 20 October 869 PCNs issued | 869 |
| 21 – 27 October 755 PCNs issued (6 days enforcement) | 755 |
| 28 Oct – 3 November 416PCNs issued | 416 |
| 4 Nov – 10 November 146 PCNs issued # | 146 |
| 11 – 17 November 240 PCNs issued # | 240 |
| 18 – 24 November 251 PCNs issued # | 251 |
| 25 Nov – 2 December 595 PCNs issued | 595 |
– Of all PCNs reviewed, up to Monday 8 December 2013, there was a 30:70 split on YO and non-YO postcodes.
# – only one camera operational.

